

Our last blog, Healthcare 2030 (Part 3), we discussed demographics and what we expect will be an accelerated demand for healthcare as Baby Boomers age. As we continue this series, we will elaborate more on this discussion and provide our reasons why we believe things are different this time.
First, we have expanded our Company’s news releases and have added on a new project, podcasting. If you haven’t heard our first episode yet, be sure to head over to our partner site, OXIOHealth.io and sign up for our free podcast episodes called, Healthcare 2030. We are very excited to bring you this new project as we discuss the latest healthcare trends, future direction of healthcare, innovation and technology.
Second, I want to drill down into some detail to answer some questions that have been asked. Out of necessity, this will be a bit “dry” however, I believe you will find the information worthwhile.
One of the questions I’ve been asked was, “why do you think so much in healthcare will change over the next 10 years? Especially considering how little it has changed in the past 10 years.”
The second question was, “why do you believe that demographics are so central to investing, business opportunity and economics? Is it always about demographics with you?”
These questions will be addressed in the next couple of blogs, as well as our upcoming podcast (Episode 2); however, I’ll begin with a little history to set the context and help define some of the key driving forces behind the answers to these questions.
For the first time in recorded history, we have more people over the age of 65 than under the age of 5, today.
The median age by country:
- Japan 47.3,
- Germany 47.1,
- Italy 45.5,
- U.S. 38.1
- China is 37.4[1]
These static numbers make more sense when viewed historically with their associated trend lines. To answer both questions above, we are going to use Japan as the prediction of the future for the U.S., and maybe even a lesson for the European Union and China.
Japan became a major industrial power by the mid-1970s fueled by a meteoric rise from post-World War II. I still remember the iconic Sony Walkman released in 1979 – a point in history where Japanese industries were impacting the world as never before. By the mid-1980s, Japan’s gross exports and trade policy had begun causing a serious trade deficit for the United States and then our trade policy changed.
The first new car I bought was a 1982 Datsun (today Nissan) 280Z, and I was in love with my car. It was fast, relatively cheap and was a compromise to the car I wanted, yet could not afford, the Chevrolet Corvette.
Many of us remember news about the Japanese companies buying landmark U.S. properties, and just like that, everything changed. By the 1990s, Japan had entered a challenging economic period that has lasted to today. Many issues have been attributed to the slowdown, and at times, scary to near implosion of Japan. Since the late 1990s through today, the Japanese central bank has kept the lowest interest rates in the developed world. This double-edged sword benefits growth and investment in more easily funding means of production; however, it is a disincentive to personal/private saving. Even so, Japan still has one of the highest private savings rates of any developed nation, even after adjustments for various accounting methods. The higher propensity to save provides some fuel to the economy, and yet the Bank of Japan has still had to take the extraordinary move on several occasions to buy equities in order to improve liquidity and resiliency in the economy.
The Japanese problem is far more complex than this simple treatise and includes some self-inflicted issues, yet we believe the “elephant in the room” is mostly demographics-driven; this is why.
The population in Japan has been quickly aging, fertility rates have dropped, and recently millions of Japanese have begun to retire. To provide some understanding of the internal economic pressures this creates, let’s discuss the term Age Dependency Ratio (ADP)[2],[3]. The ADP is quite simply the ratio between the “non-working” and “working” populations to measure the pressure on the “productive population.” What we will concentrate on, for the purpose of our discussion, will be the rapidly growing ratio, “Old Age Dependency Ratio” and what we believe contributes most of the pressure on the productive population:
The age dependency ratio expresses the relationship between three (3) age groups within a population: ages 0-15, 16-64 and 65-plus. Higher values indicate a greater level of age-related dependency in the population. The “dependent population” is defined as people ages 0-15 and 65-plus, while the “working age population” is defined as people between ages 16 and 64. This is consistent with the definition used by the U.S. Bureau of Labor Statistics.
There are three (3) types of age dependency ratio. The youth dependency ratio is the population ages 0-15 divided by the population ages 16-64. The old-age dependency ratio is the population ages 65-plus divided by the population ages 16-64. The total age dependency ratio is the sum of the youth and old-age ratios divided by the working population. All three ratios are commonly multiplied by 100 to obtain the “percentage.”
When you write this as a formula it looks like this:

I also have also found the following video a good source if you would like to explore this topic further: https://www.investopedia.com/terms/d/dependencyratio.asp.
By graphing the Old Age Dependency Ratios for Japan, Europe and the U.S. over the last 70 years, there is a clear departure upward in the ratio for Japan indicating that there are far more people turning 65 than entering the work force. This provides a much clearer picture of one key contributor to the economic pressures that Japan has faced since the 1990s. The following graph depicts these numbers and provides a forward looking (because of demographic trends) for the next 50 years that show that the Old Age ADR for Japan continues to worsen much more rapidly than the U.S. and Europe.
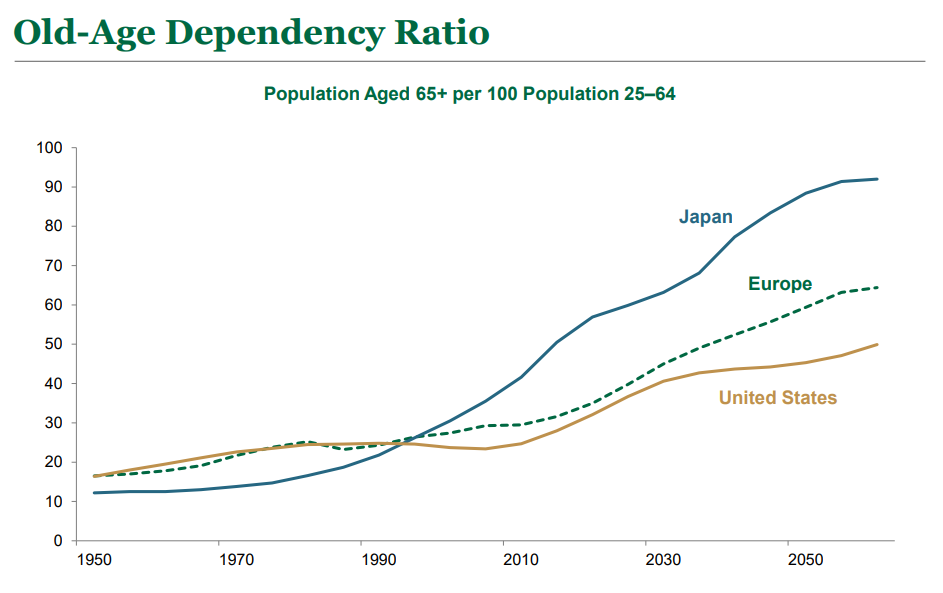
As shown, the Old Age Dependency Ratio in Japan began accelerating upward by the mid-1980s and continued to accelerate into 2050. Also note, that Europe is accelerating faster than the U.S., yet the numbers cannot be ignored as the pressure on the productive work force continues to increase annually.
Some have begun to call this the “Japanification” of the developed world. The fact is, Japan’s working age population has contracted (or more accurately failed to replace those entering retirement) by 12% since 1990. Some expect this to drop another 8% by 2045; meaning a full contraction of over 20% for the period! The outlook for Europe and the U.S. is better, but not by a great deal in the long run:
- Europe is on a slower upward trajectory and experts expect a contraction of working age adults of 15% by 2048 in Europe. The greatest pressure, statistically, is on Italy, Germany and Spain in that order.
- The U.S. is presently in the best shape between Japan and Europe, and yet between 2014 and 2045 the U.S. population aged over 65 will climb from 15% to over 20%, while the “Old Age” ADR will go from 28% to 36% owing to the ongoing retirement of the Baby Boomer at a rate of 10,000 per day. It could be argued that one of the reasons the U.S. unemployment rate is so low is in part demographics. Even though the Millennial generation in the United States has passed the Baby Boomer generation as the largest generation in the United States.
- Note, these statistics do not include future immigrant populations in Europe and the U.S. that are typically in the 0-15 and 16-64 age groups which would provide some skewing of these statistics; “however, migration alone will almost certainly not reverse the ongoing trend of population aging experienced in many parts of the EU[4].” We suspect that may likely be true for the U.S. as well. The greater question, and we will leave this part of the discussion, is what is the ADR for the immigrant population given the wide skills and needs gap in the “destination country’s” labor force? This only applies for Europe and the U.S. as Japan has historically resisted “open” immigration.
This is a long blog however, it provides a sound basis to our assertion that the best market segment for investment, employment and startups/business is clearly in healthcare (we are partial to technology) and healthcare-related services. From our view, healthcare that provides a positive change to reduce the impact to the “working population” from the “Old Age ADR” dynamic we have reviewed, will be in the areas of cost management/reduction, transparency and value-based care. These companies should see the fastest and most consistent growth through 2050, as the aging statistics are sound.
In the U.S., we see major drivers of innovation will become the better use of technology. In fact, we see technology-infused care, not just technologies used in healthcare. It is clear that everything from 5G, IoT, AI, predictive analytics, telemedicine combined with a healthy dose of price and physician-patient relation transparency, and a huge acceleration of managed-care (in Medicare Advantage) are the tools that have arrived at the right place at the right time, and at the most important industry in the world today where their impact can drive a profound and lasting positive change.
-Noel J. Guillama, President
[1] China is trailing and moving to catch up fast (subject of future blog)
[2] https://en.wikipedia.org/wiki/Dependency_ratio
[4] https://ec.europa.eu/eurostat/statistics-explained/index.php/Migration_and_migrant_population_statistics
[3] https://www.investopedia.com/terms/d/dependencyratio.asp